
Support · Reports and surveys
Reports
See how the helpdesk is doing, build your own reports, save them, and get them by email.
Reports answer questions like “Is the pile growing?” and “Which sites keep us busiest?” Every report counts only tickets in your own areas: your teams and the departments you manage, or everything if you see every ticket. A shared report works the same way, so two people can open it and see different numbers.
Start with the overview
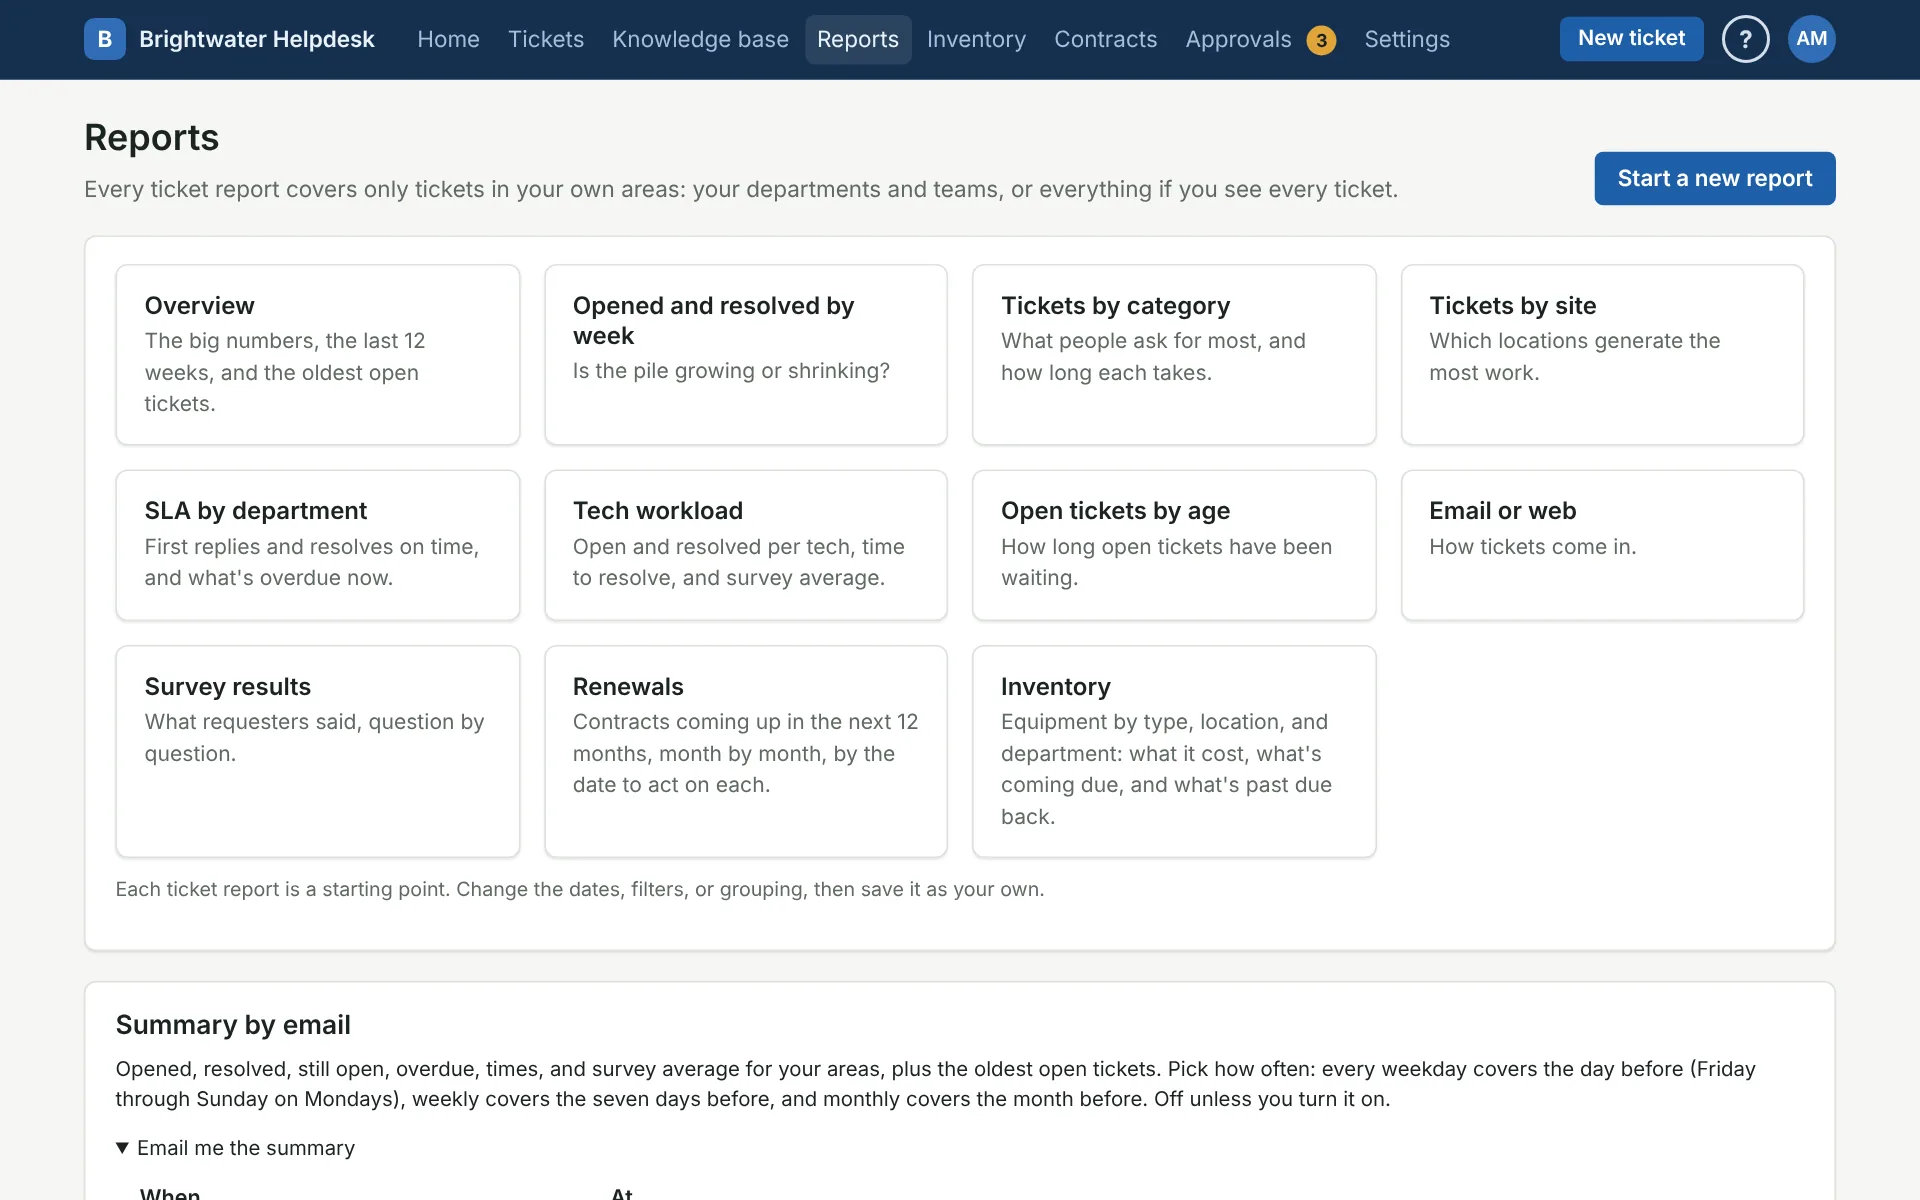
Overview has the big numbers for the time you pick: opened, resolved, open now, overdue now, average first reply, average time to resolve, resolved on time, and the survey average. Below that are the last 12 weeks, the top categories, open tickets by age, and the oldest open tickets. Click one of the top numbers to open the report behind it.
The other tiles on the Reports page are ready-made reports, like Tech workload and SLA by department. Each one is a starting point you can change.
Build a report
Click Start a new report, or open any tile. The panel on the left sets it up:
- When: a period like Last 30 days, or Pick dates and fill in From and To.
- Count tickets: opened in that time, or resolved in that time.
- Group by: department, team, category, tech, site, week, requester, organization, and more. You can also group by the answers to a pick-from-a-list question on a form.
- Show: the numbers you want, like tickets, still open, or average time to resolve. The first one ticked is charted and sorts the list.
- Who and what, Where, and More filters narrow it down.
Click Run. Times count business hours, so a ticket opened Friday afternoon and closed Monday morning took a couple of hours, not three days.
Save it
Under Save this report, give it a name and click Save. It keeps choices like “last 30 days,” so it’s current every time you open it. Tick Share with everyone who can run reports to put it in their list.
On your own saved report, Save changes updates it and Save as a new report makes a copy. Saving a report someone else shared makes your own copy, and theirs stays as it was.
Download it
Download CSV gives you the table as you see it. Download the tickets gives one row per ticket, handy for Excel.
Get it by email
On a saved report, open Email me this report, pick When and At, and click Start emailing it. You can have it every weekday, every day, once a week on any day, or once a month on a date or the last day. The report keeps its own dates, like “last 30 days,” so pick dates that suit how often it comes: a daily email of a “Last week” report says the same thing all week.
For a quick look at your areas, use Summary by email on the Reports page the same way. It covers opened, resolved, still open, overdue, times, survey average, and the oldest open tickets. Every weekday covers the day before (Friday through Sunday on Mondays), weekly covers the seven days before, and monthly covers the month before (on the last day of the month, that month so far).
Both are off until you turn them on. Change when it comes and Stop emailing it are right there once it’s on. If the helpdesk is down when one is due, it still goes out a bit late: the same day for daily ones, up to two days for weekly, three for monthly.
A report counts up to 50,000 tickets. If more match, you’ll see a warning. Narrow the dates or filters.
More on reports and surveys
Still stuck?
Search all the guides or write to us on the Support page.